An abnormal reading is usually a symptom, not the cause. A fault starts in one place and spreads through the turbine's physical coupling chains: lubrication to bearing temperature, converter voltage to pitch motor current, and on to rotor speed and power. To support maintenance, diagnosis has to name both the faulty subsystem and the variable where the abnormality began.
We treat diagnosis as physics-constrained spatio-temporal reasoning. A quantum-enhanced digital twin learns the turbine's normal dynamics from SCADA data and scores how abnormal each variable is over time. A prior graph built from known physical couplings between turbine variables then constrains how abnormality is allowed to propagate. The result is a system-level fault class together with a variable-level root-cause trace.
Diagnosis accuracy
Real wind farm SCADA data; faults in the pitch system, gearbox, generator and power converter.
precision 0.989, recall 0.967
1 − nRMSE 0.9994
| Method | Accuracy | F1 | Precision | Recall | R² | 1 − nRMSE |
|---|---|---|---|---|---|---|
| Ours | 0.9957 | 0.9769 | 0.9888 | 0.9668 | 0.9968 | 0.9994 |
| DBANet | 0.9913 | 0.9625 | 0.9732 | 0.9548 | – | – |
| 3DSE-CNN-2DLSTM | 0.9896 | 0.9578 | 0.9691 | 0.9494 | – | – |
| PatchTST | – | – | – | – | 0.9974 | 0.9963 |
| PGM-MTGNN | – | – | – | – | 0.9899 | 0.9903 |
| GRU | – | – | – | – | 0.9716 | 0.9654 |
Diagnosis baselines classify faults only; temporal baselines only forecast. Our framework does both with about 0.30 M parameters, against 2.70 M for PatchTST.
Root-cause tracing
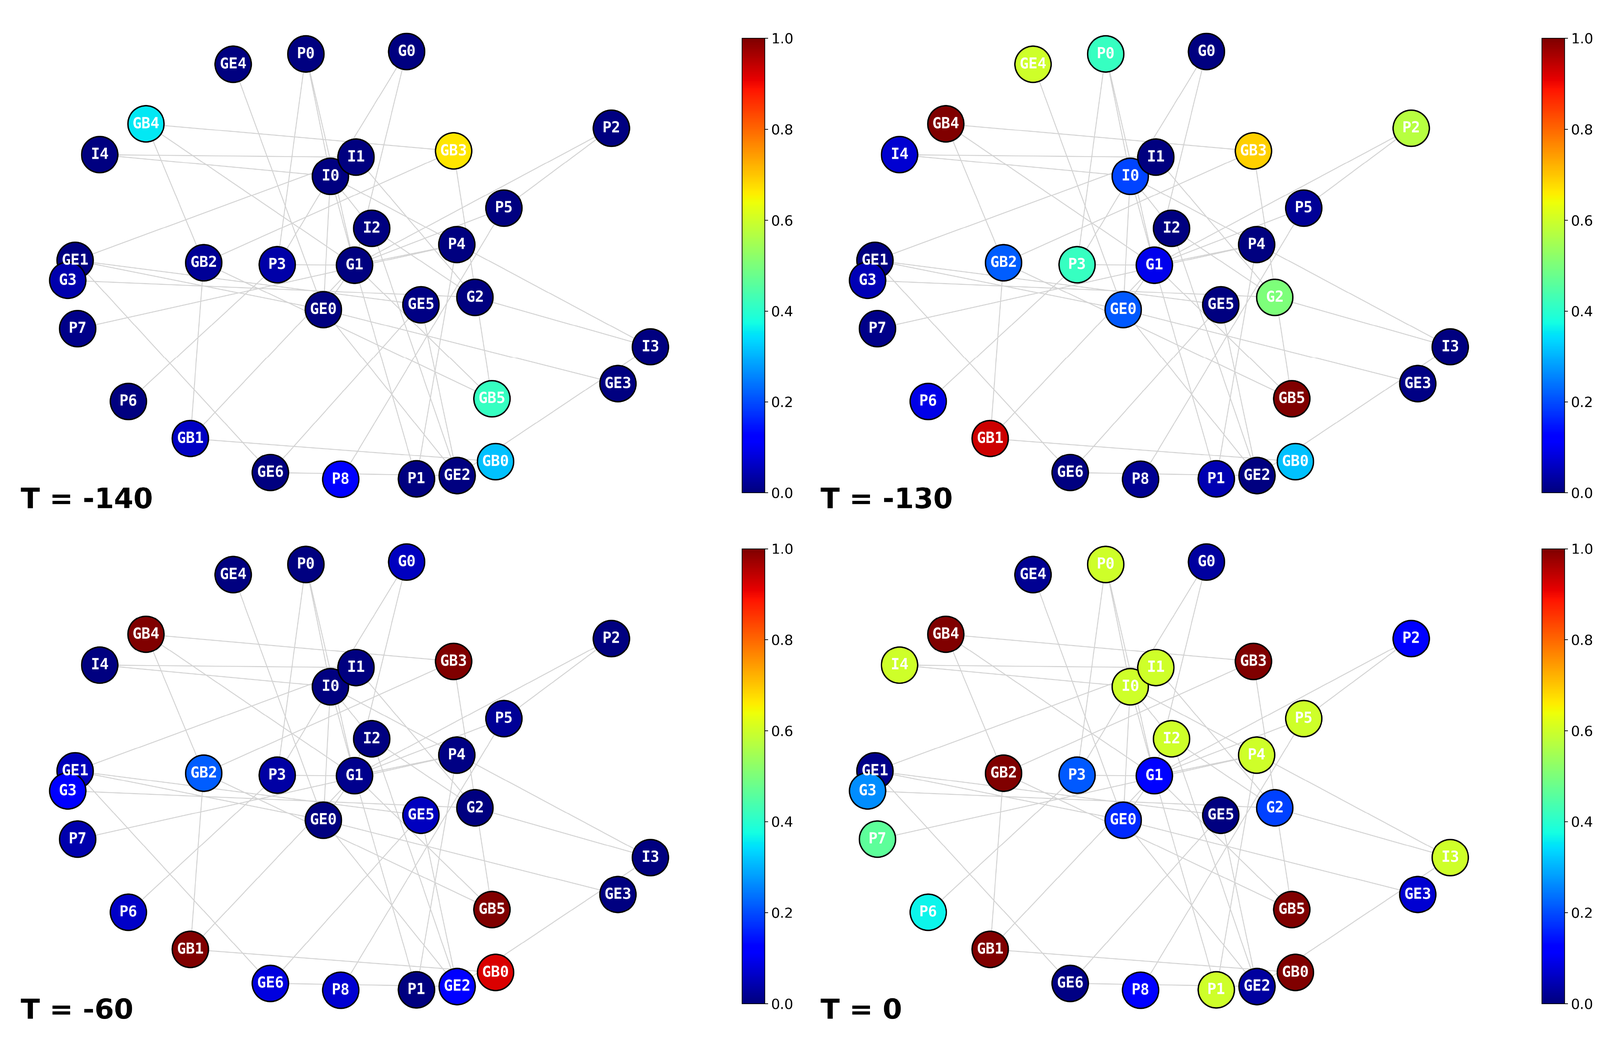
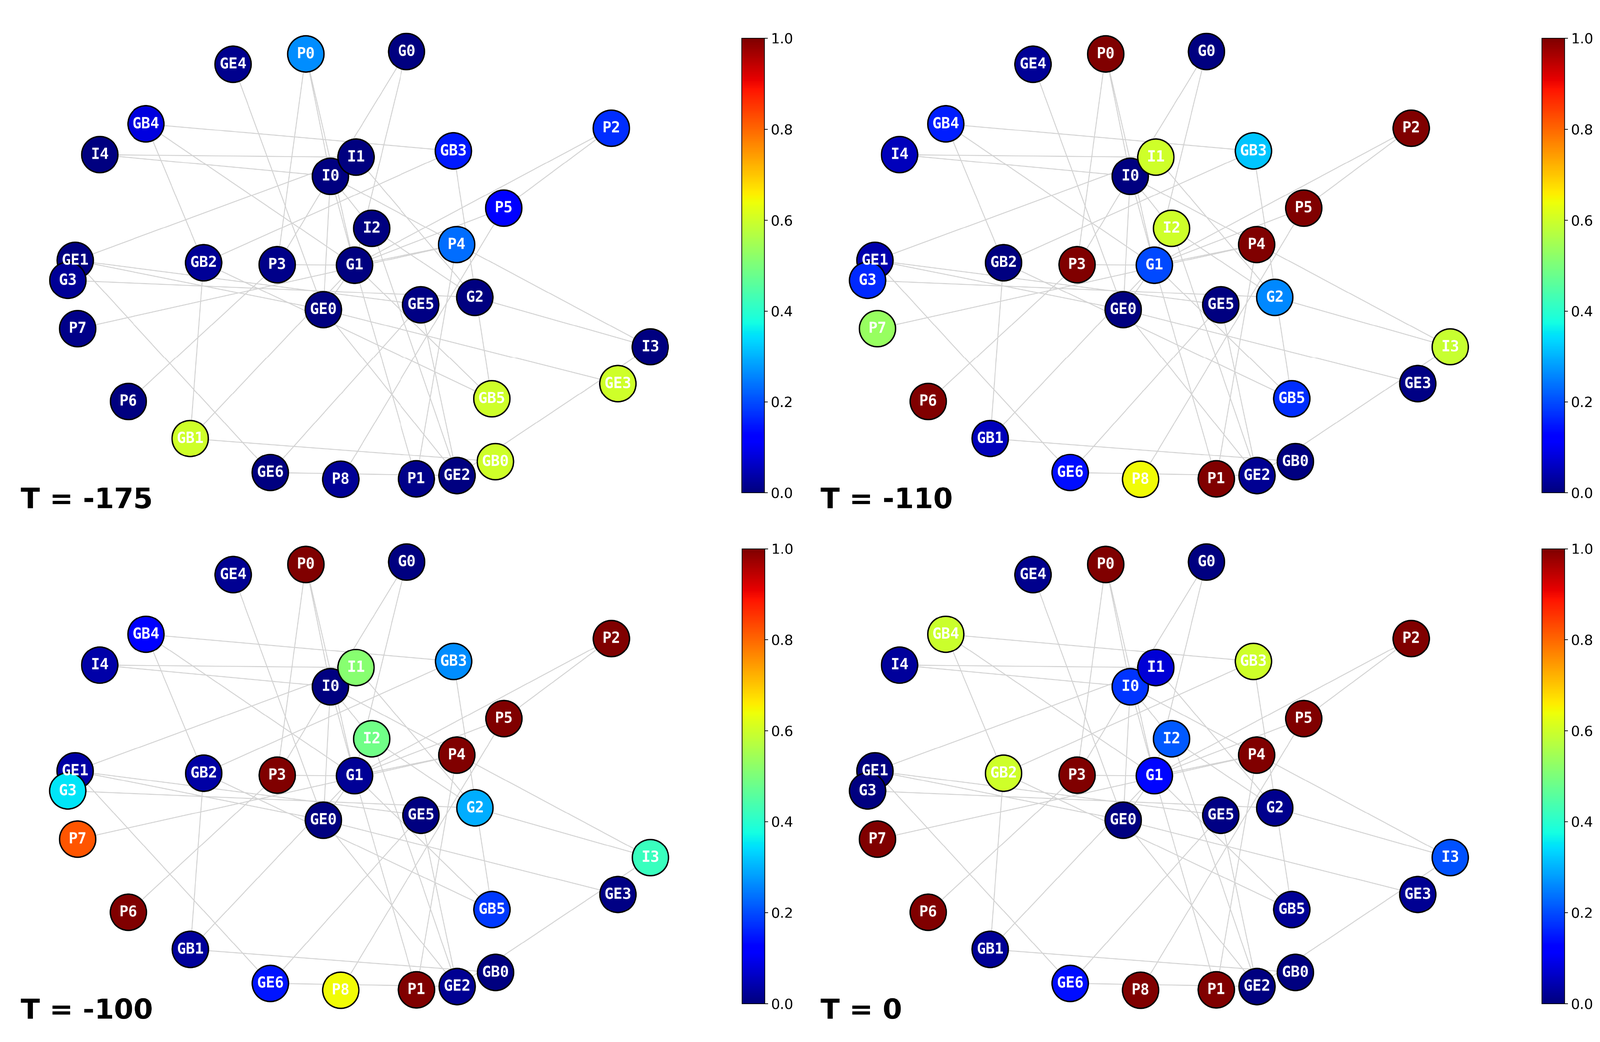
Each graph shows the turbine's SCADA variables as nodes, coloured by normalised anomaly score from deep blue (normal) to red (strongest abnormal contribution). Snapshots are taken at time steps before the fault is triggered (T = 0). Node labels: GB gearbox, P pitch system, GE generator, I inverter, G general operation (e.g. rotor speed).
Case: gearbox oil sump over-temperature
The alarm logs attribute this fault to a blocked oil pipeline: abnormal oil pressure reduced lubrication and led to thermal runaway. The trace finds abnormality forming inside the gearbox lubrication and thermal variables long before the fault, and staying concentrated there, consistent with the maintenance record.
Case: pitch angle deviation
Pitch faults typically start with unstable converter voltage or abnormal motor current, which push the blade away from its intended angle and then disturb rotor speed and power. The trace identifies the pitch converter as the dominant source.
At fleet scale
In TurbineCore, component-level diagnosis covers twelve turbine components across four wind farms.