TurbineCore is an autonomous condition monitoring system. Every day, for every turbine, it reads the machine's own SCADA record, works out how healthy it is, and decides how hard it should be allowed to run, with no engineer needed in the loop for the analysis.
The demo is password-protected while the related paper is under peer review. Contact us for access.
Autonomy
Conventional condition monitoring stops at alarms: a value crosses a fixed limit and an engineer has to work out why, what happens next, and what to do. TurbineCore closes that loop itself. It runs the whole chain from data to decision on its own, each turbine-day, and only hands the result to people.
Observe
Reads the day's SCADA record, whatever the farm calls its signals
Assess
Compares the turbine with its own healthy behaviour
Diagnose
Names the component that is drifting
Predict
Estimates failure probability over the coming weeks
Decide
Simulates candidate power limits and picks the day's setting
Explain
Writes up the evidence and the decision for an engineer
Three things make it autonomous rather than automated:
- It models its own consequences. The world model predicts how the turbine will respond to a command, so the system can test an action before recommending it instead of following fixed rules.
- It knows when not to act. Every decision is priced on energy, failure risk, availability and cost under a pessimistic estimate; on most days the answer is to do nothing.
- It transfers. One shared vocabulary lets the same system run on wind farms with different turbines, sensors and signal names.
Autonomy has deliberate limits. Interpreting the data, updating each turbine’s health state and computing the decision are automatic; confirming maintenance facts, defining operating constraints and authorising any real action on a turbine remain with people.
How it works
A wind turbine already reports everything it does: power, wind speed, temperatures, pressures, vibration, pitch and yaw angles, alarms, and the limits the controller was given. TurbineCore learns what a particular turbine normally does with that record, notices when it stops behaving that way, works out which component is drifting, says how likely a failure is over the coming weeks, and then decides how hard the turbine should be allowed to run.
The decision is deliberately narrow: the only action is the power limit the operator would send anyway. Holding a turbine below its rating costs energy today and buys a lower chance of losing it for a week. The system prices both sides of that trade with its own model of the turbine before recommending anything.
The building blocks
One vocabulary for five farms
Every farm names its signals differently. Each channel is mapped onto a shared semantic description (component, physical quantity, unit, and whether it is a measurement or an operator command), so a model trained on four farms can read the fifth.
The world model
Given a turbine's recent history and the commands it is about to receive, it predicts every channel with an uncertainty band: a learned stand-in for the machine that answers "what would this turbine do if we capped it at 1.6 MW tomorrow?"
Anomaly detection
A copy of the world model trained only on confirmed-healthy periods sets expectations; the gap between expectation and reality is the anomaly score, which surfaces slow drifts long before an alarm fires.
Fault diagnosis
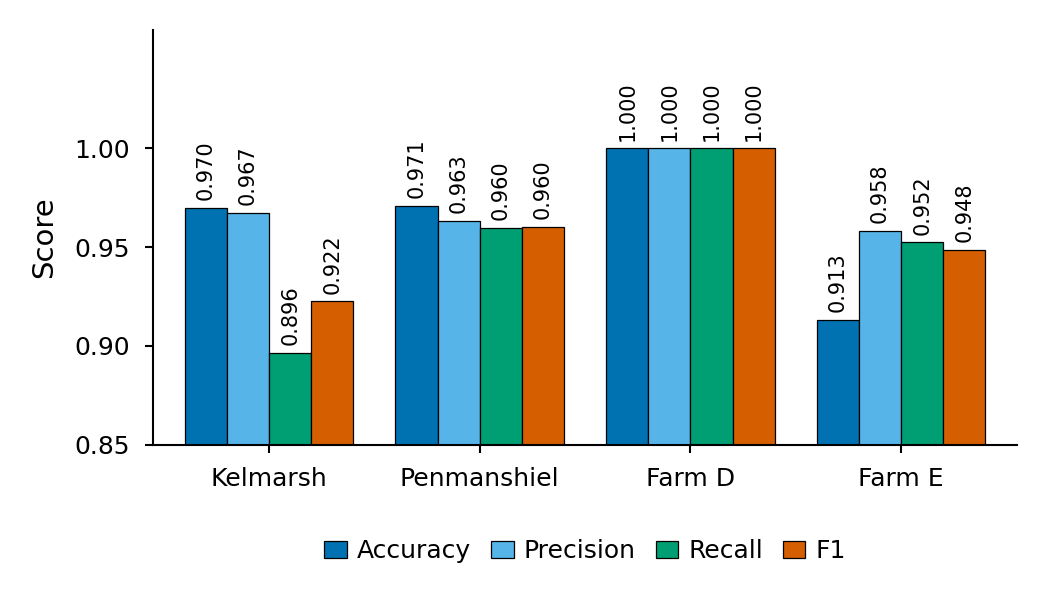
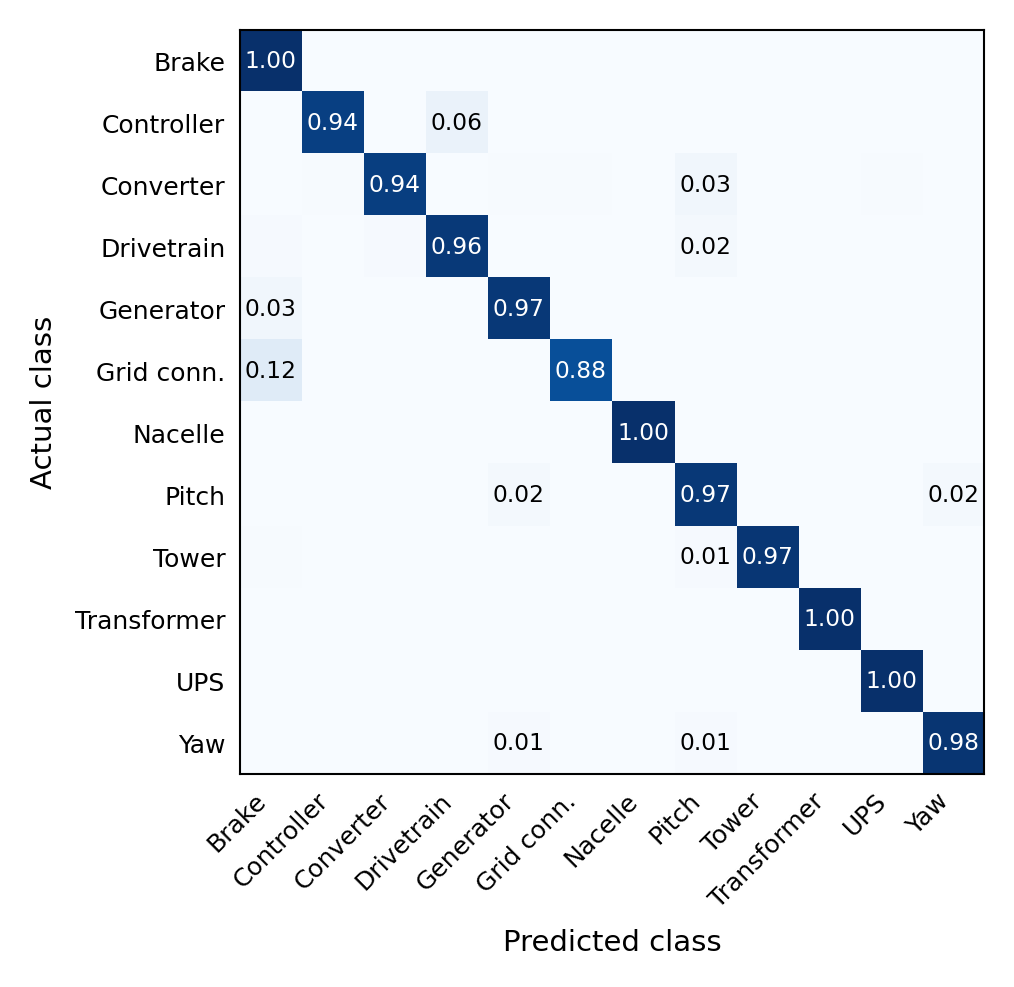
The same gap, read channel by channel, says where the trouble is: gearbox, generator, converter, pitch or yaw system, down to subcomponent level.
Failure probability
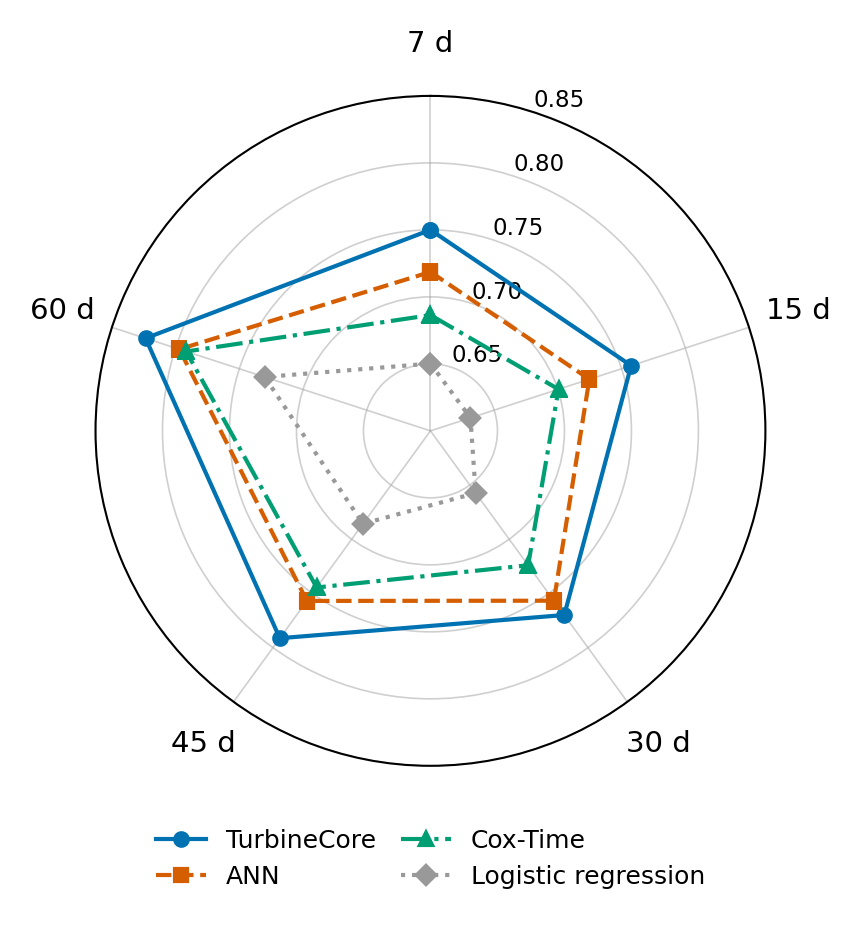
The probability of failure within 7 to 60 days, recalibrated against recorded failures so that a stated 10 % means roughly one in ten in practice.
Written audit & policy
A locally hosted language model writes up each turbine-day for an engineer to challenge. Candidate power limits are simulated through the world model and scored on energy, failure risk, availability and cost; on most days the policy does nothing.
Results
World model
Forecast accuracy of the world model over all channels of the held-out blocks, against the persistence baseline (“the next value equals the last one”). MASE below 1 means the model beats persistence.
persistence 0.847
persistence 0.832
persistence = 1
63.9% recall at 5% false alarms
| Farm | Model | R² | MAE | RMSE | MASE | Scored cells |
|---|---|---|---|---|---|---|
| Penmanshiel | World model | 0.9276 | 0.152 | 0.293 | 0.709 | 493,621 |
| Penmanshiel | Persistence | 0.8474 | 0.214 | 0.425 | 1.000 | 493,621 |
| Hill of Towie | World model | 0.9283 | 0.133 | 0.288 | 0.724 | 2,066,680 |
| Hill of Towie | Persistence | 0.8316 | 0.184 | 0.442 | 1.000 | 2,066,680 |
MAE and RMSE are on standardised channel values. Numbers are the precomputed results shown in the live demo.
Decision study
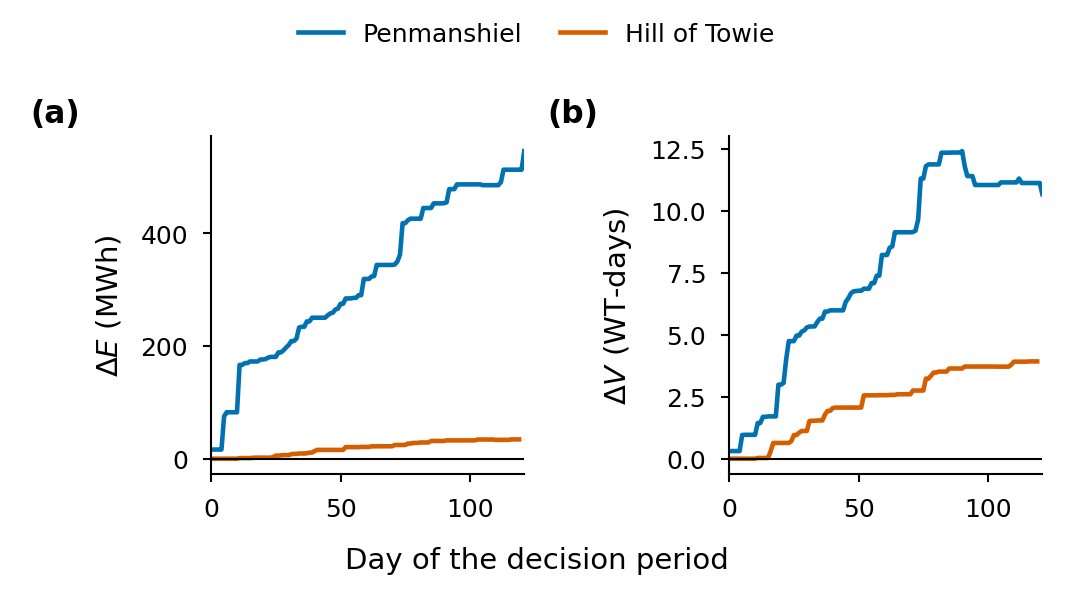
The learned power-limit policy is replayed through the world model over recorded operation and compared with what each farm actually did over the same turbine-days. A policy counts as better only if it raises generation, lowers failure risk, keeps availability and lowers O&M cost at the same time.
| Farm | Operation | Energy (MWh) | vs actual | O&M cost vs actual | 15-day failure risk | Availability | Days acting |
|---|---|---|---|---|---|---|---|
| Penmanshiel | Actual operation | 14,319.7 | – | – | 0.1922 | 78.90% | – |
| Penmanshiel | TurbineCore policy | 14,535.4 | +1.51% | −1.78% | 0.1869 | 78.99% | 47 |
| Penmanshiel | Energy & risk only | 14,679.3 | +2.51% | −0.17% | 0.1890 | 78.26% | 75 |
| Hill of Towie | Actual operation | 22,967.1 | – | – | 0.5260 | 59.84% | – |
| Hill of Towie | TurbineCore policy | 23,004.7 | +0.16% | −0.67% | 0.5227 | 59.66% | 47 |
| Hill of Towie | Energy & risk only | 23,043.3 | +0.33% | −1.41% | 0.5186 | 59.26% | 100 |
Penmanshiel: 14 turbines, 1 Nov – 31 Dec 2022, 854 turbine-days. Hill of Towie: 9 turbines, 1 Jan – 30 Apr 2026, 1,080 turbine-days. "TurbineCore policy" is the four-objective actor-critic; "Energy & risk only" optimises two objectives and gains more energy at the cost of availability. These are offline counterfactual estimates, not field trials.
Diagnosis, failure prediction and policy
Data and scope
Results come from recorded operation at five wind farms, with the decision study carried on two of them. Public datasets include Kelmarsh, Penmanshiel and Hill of Towie. The language model runs locally and no plant data leaves the project’s machines. Every figure in the demo is precomputed from result files; nothing touches a live turbine.
Related publications
-
Energy Conversion and Management: X, vol. 31, 101918, 2026. doi:10.1016/j.ecmx.2026.101918
-
Energy Conversion and Management, vol. 332, 119694, 2025. doi:10.1016/j.enconman.2025.119694
-
2025 30th International Conference on Automation and Computing (ICAC), IEEE, pp. 1–6, 2025. doi:10.1109/ICAC65379.2025.11196477